
Economic and Social Dependencies on Biodiversity
The Living Planet Index – a measurement of species population trends
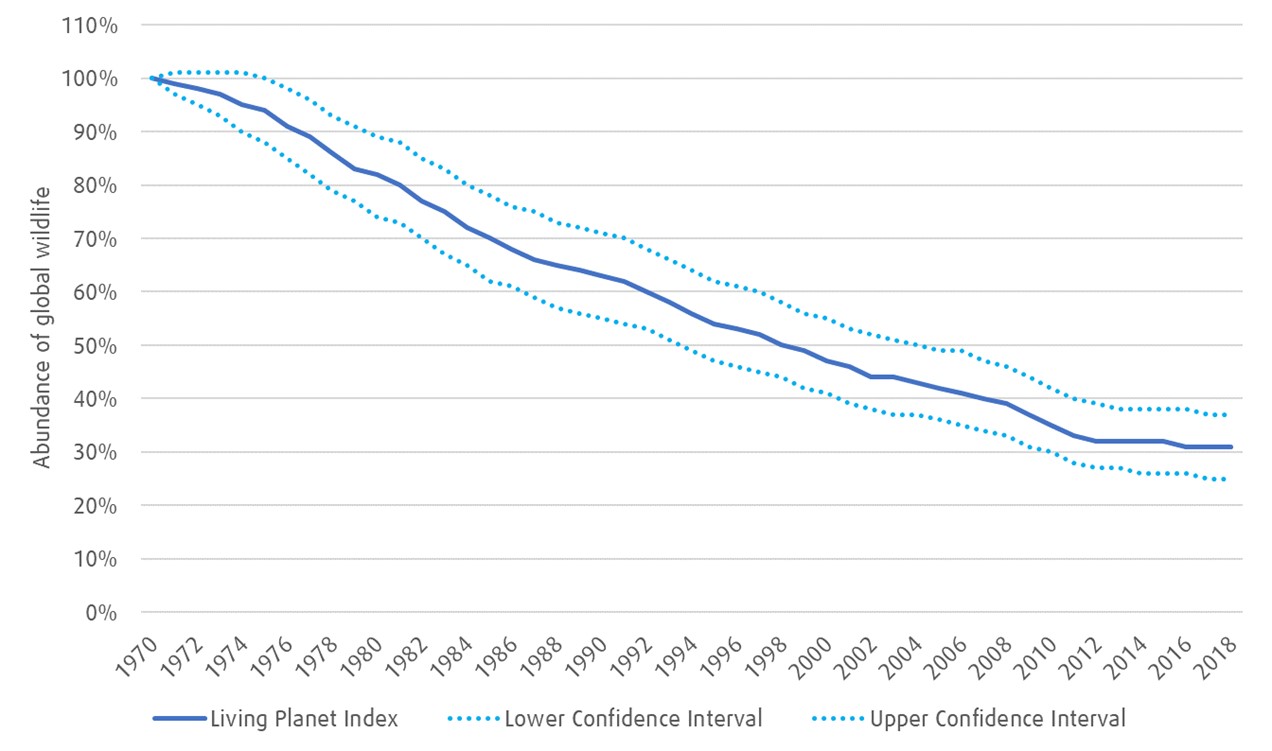
Source: Living Planet Report 2022, WWF, Zoological Society of London. The Living Planet Index is a time-series based on population, density, and abundance of the world’s biodiversity.
To learn more about the risks biodiversity loss brings and the recent outcomes of COP15 in Montreal, where global leaders came together to agree on a Global Biodiversity Framework, read “Why Investors should care about Biodiversity (bmogam.com)”.
Coordinated effort from businesses, standard setters, policy makers and individuals are required to reach the desired outcomes of the Kunming-Montreal Global Biodiversity Framework (announced in December of 2022 at COP15) as well as the United Nations Sustainable Development Goals (SDGs) by 2030. Investors have a distinctive position to contribute to making change happen. As shareholders we have a unique voice to promote best practices and encourage prudent biodiversity risk management at investee companies, while providing a valuable perspective to policy makers and standard setters. In this article, we focus on the pressures caused by our economy and society, how the impacts and dependencies on biodiversity can be assessed by investors, and how reporting frameworks and evolving standards can help investors manage risks related to biodiversity loss. We’ve demonstrated the links between investors, businesses, and biodiversity in the following schematic, which serves as a guide to this article.
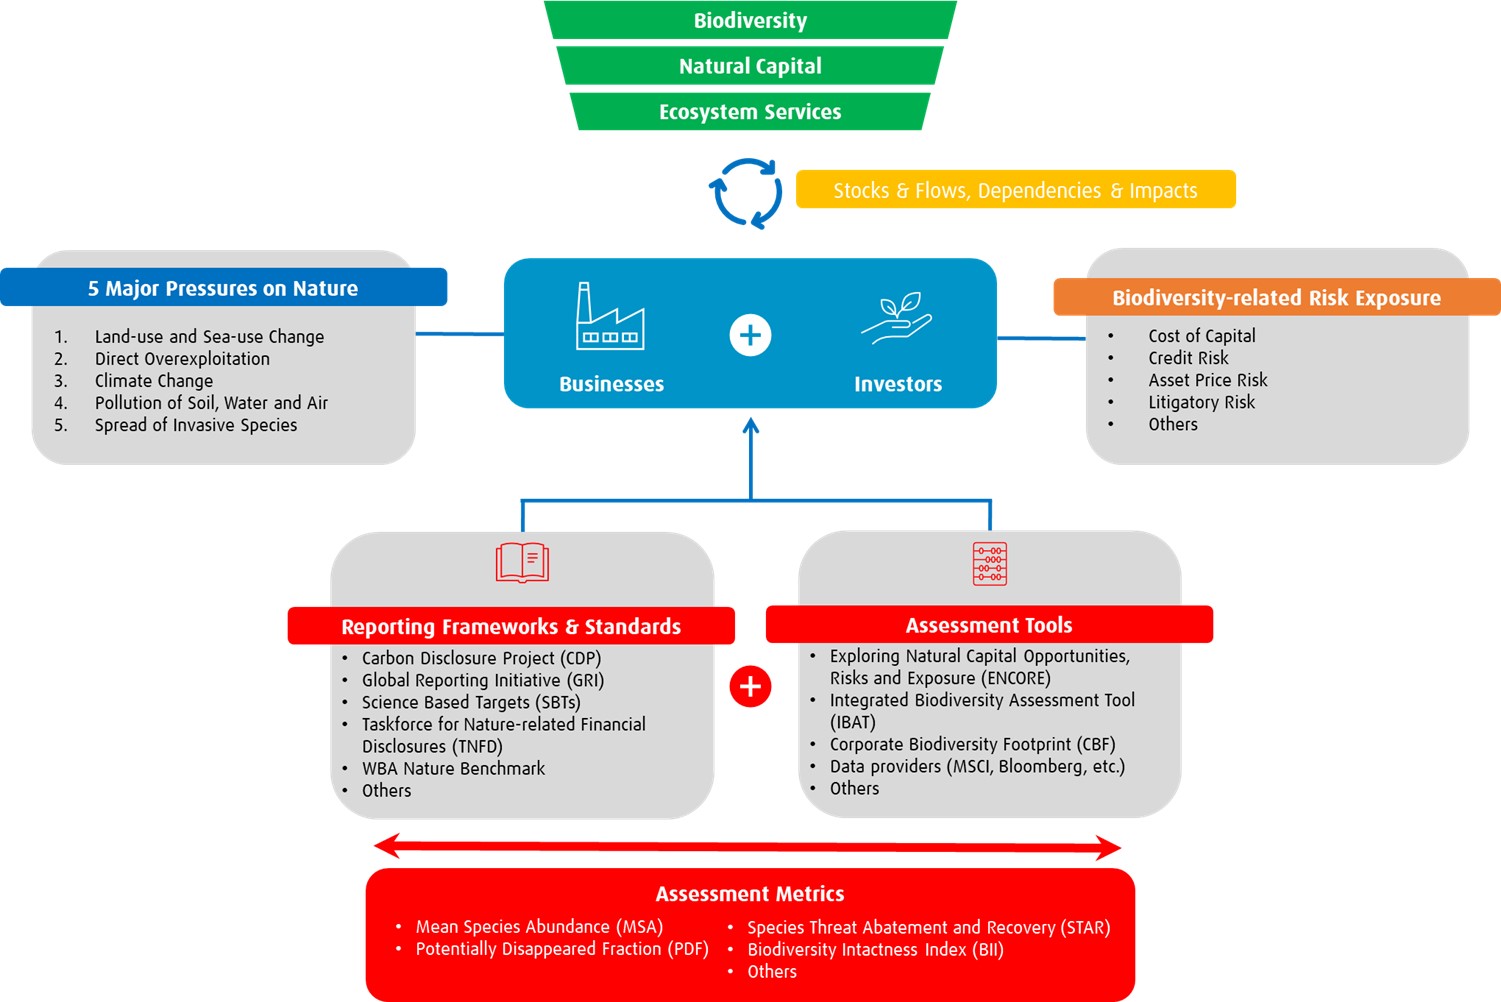
Source: BMO Global Asset Management
Five Major Pressures on Biodiversity and their Implications for Investors
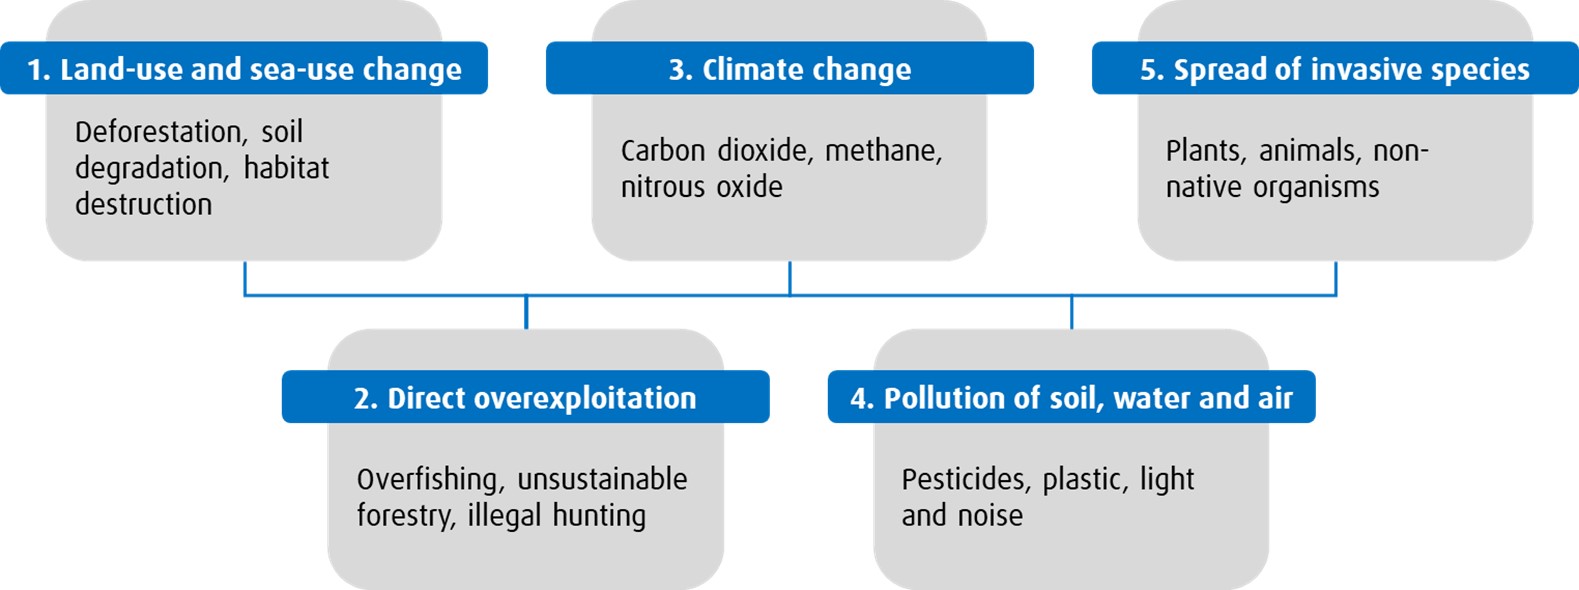
Source: IPBES, “The global assessment report on Biodiversity and Ecosystem Services”
The implications of these five major pressures on nature are concerning from a systemic risk point of view. Broad exposure to the financial markets comes with an inherent dependence on the well-functioning of socioeconomic systems, which rely on the health of the planet. The greater the pressures on our planet become, the more systemic risk our investors face.
- Land-use and sea-use change reduces the quality and productivity of our ecosystems. Economic activities such as agricultural operations and deforestation can cause soil erosion, salinization, and desertification4, while growing consumption and population cause swift expansions in infrastructure at the expense of forests and wetlands. This leads to difficulties in sustaining crop yields and requires additional investments in infrastructure like water filtration.
- Direct overexploitation harms the balance of our food systems. Unsustainable overharvesting of resources causes lasting damage. Important populations of fish that people depend on have been reduced to near extinction5 and unsustainable deforestation leads to immediate impacts on our climate, such as changes in rainfall and, along with other land-use change, accounts for 15-20% of global carbon dioxide emissions6.
- Climate Change caused by greenhouse gas (GHG) emissions leads to warming land, air, and water temperatures, which impacts habitats and ecosystems. Roughly half of human-caused emissions remain in the atmosphere, while the other half is absorbed by the land and ocean7. The ecosystems that capture and store carbon from the atmosphere, like the boreal forests of North America or the kelp forests off the coast of Australia, are so-called nature-based solutions for climate change. Avoiding deforestation and limiting GHG emissions causing rising air and water temperatures helps to protect the stability of these ecosystem services. While companies around the world have acknowledged risks associated with climate change and committed to reducing their GHG emissions, the economy is still dependent on the protection and restoration of nature-based solutions.
- Pollution of soil, water, and air, caused by the introduction of harmful chemicals or microorganisms, can further deplete ecosystems, and put human health at risk. Agricultural run-off can cause eutrophication, whereby algal blooms grow rapidly feeding off increased levels of ammonia and phosphate. Soil can become contaminated by chemicals emitted from mining operations. Furthermore, the oil and gas industry is the largest industrial source for emitting volatile organic compounds (VOCs), which contribute to local ground-level smog8.
- Spread of invasive species can be caused by the movement of people and goods across the planet. Whether in the food imported from a different country or in the water ballast of a ship, the harm of invasive species on local ecosystems and economies can be great. Collectively, invasive species such as the Japanese Knotweed and Zebra Muscles cost Canada an estimated $16.6-34.5 billion per year9.
Biodiversity Risk Exposure Assessment for Investors
Understanding biodiversity risk can be complex for investors. Beyond the aforementioned systemic risks, individual companies are increasingly exposed to reputational, regulatory, policy and litigatory risks. For instance, the financial risks of liability and litigation related to biodiversity and ecosystem services are increasingly flagged by central banks, regulators, and market participants10. Nature dependencies and negative impacts also increase credit risk, cost of capital, and can impact asset pricing.
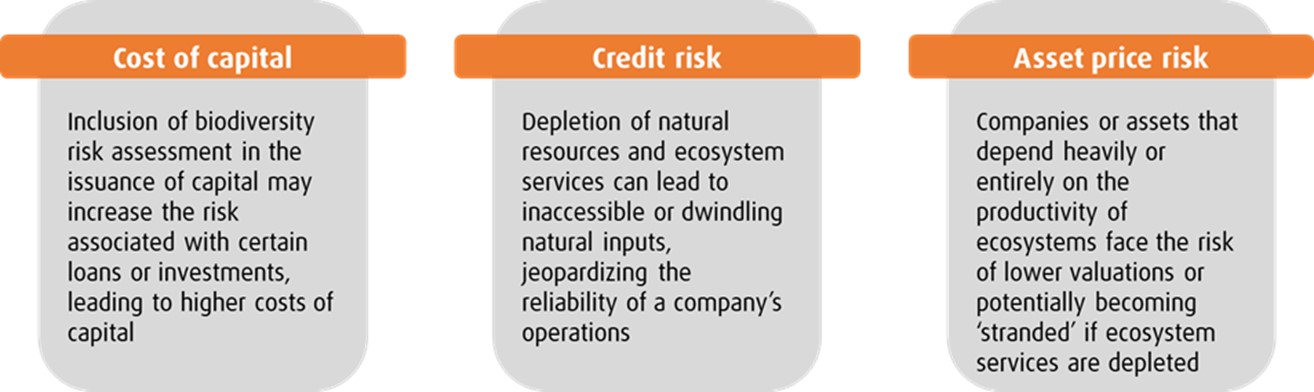
Source: BMO Global Asset Management
Issuer Exposure to Nature
Increasingly, companies are reporting through biodiversity frameworks such as the CDP (formerly the Carbon Disclosure Project). In 2022, more than 7,700 companies disclosed biodiversity data through CDP11 , representing about 41% of all companies that participated in CDP.
- The Taskforce for Nature-Related Financial Disclosures (TNFD)
- The TNFD is an emerging framework that will allow businesses and investors to assess and manage financial exposure to biodiversity-related risks12. Similar to how company reporting in the Taskforce for Climate-Related Financial Disclosures (TCFD), investors will be able to use TNFD reporting to evaluate how investee companies manage exposure to impacts and dependencies on biodiversity. Investors will be able to see:
- Board and management’s roles in overseeing, assessing, and managing nature-related dependencies, impacts, risks, and opportunities
- Disclosure of such actual and potential impacts on the organization’s operations, strategy, and financial planning
- Description of how such impacts are identified, assessed, and managed
- Which metrics and targets are used to track performance on biodiversity
- The TNFD is an emerging framework that will allow businesses and investors to assess and manage financial exposure to biodiversity-related risks12. Similar to how company reporting in the Taskforce for Climate-Related Financial Disclosures (TCFD), investors will be able to use TNFD reporting to evaluate how investee companies manage exposure to impacts and dependencies on biodiversity. Investors will be able to see:
- The Global Reporting Initiative (GRI)
- The GRI is a set of standards that help companies respond to sustainability information demands from stakeholders, including investors13. In early 2023, the GRI finalized a new collection of feedback related to their biodiversity standards. The GRI 204: Biodiversity 2016 Standard is currently under review to align with new ambitious global developments on the topic, such as the outcomes of the 2022 UN Convention on Biological Diversity. When complete, this enhanced standard will aim to:
- Broaden the scope of assessing biodiversity impacts throughout the entire supply chain
- Provide companies the ability to scale and prioritize their most significant impacts on biodiversity
- Add new links between climate change, pollution, and overexploitation of resources
- Enhance considerations of location-specific biodiversity impacts dependant on the company’s operational sites
- Introduce requirements for biodiversity-related human rights impacts, which includes indigenous peoples.
- The GRI is a set of standards that help companies respond to sustainability information demands from stakeholders, including investors13. In early 2023, the GRI finalized a new collection of feedback related to their biodiversity standards. The GRI 204: Biodiversity 2016 Standard is currently under review to align with new ambitious global developments on the topic, such as the outcomes of the 2022 UN Convention on Biological Diversity. When complete, this enhanced standard will aim to:
- CDP (Formerly the Carbon Disclosure Project)
- CDP runs a global environmental disclosure system, which allows thousands of companies, cities, and regions to measure and manage climate change, water security and deforestation risks and opportunities14. While biodiversity as a topic was only recently added to CDP annual disclosure framework, it has been established as a best practice. In 2023, CDP plans to have new questions related to biodiversity, furthering the applicability and usability of company disclosures15. Investors will be able to use these responses to assess a company’s commitments or endorsements related to biodiversity, what actions they have taken or plan to take to address biodiversity impacts, and the impact of the company’s value chain. Investors can better understand a company’s performance across several biodiversity-related topics, which includes specific questions related to timber, soy, and cattle products. Topics may include:
- Oversight and governance for biodiversity-related matters
- Public commitments and/or endorsements for initiatives related to biodiversity
- Assessment of impact of supply chains
- Biodiversity performance monitoring
- CDP runs a global environmental disclosure system, which allows thousands of companies, cities, and regions to measure and manage climate change, water security and deforestation risks and opportunities14. While biodiversity as a topic was only recently added to CDP annual disclosure framework, it has been established as a best practice. In 2023, CDP plans to have new questions related to biodiversity, furthering the applicability and usability of company disclosures15. Investors will be able to use these responses to assess a company’s commitments or endorsements related to biodiversity, what actions they have taken or plan to take to address biodiversity impacts, and the impact of the company’s value chain. Investors can better understand a company’s performance across several biodiversity-related topics, which includes specific questions related to timber, soy, and cattle products. Topics may include:
Threatened Species: The Integrated Biodiversity Assessment Tool (IBAT) leverages global biodiversity datasets such as the IUCN Red List of Threatened Species™, the World Database on Protected Areas (WDPA), the World Database of Key Biodiversity Areas (WDKBA), and the Species Threat Abatement and Restoration (STAR) Metric17.
Nature-positive Outcomes: The World Benchmarking Alliance (WBA) publishes their corporate Nature Benchmark, which measures the impacts of companies across eight key industries, including their performance towards driving nature-positive outcomes18.
If investors want to dive even deeper, they can assess a company’s quantitative data to calculate and monitor biodiversity impact metrics, such as the Mean Species Abundance (MSA) or Potentially Disappeared Fraction (PDF).
Biodiversity Metrics
Mean Species Abundance (MSA) is a metric that demonstrates the abundance of native species in an ecosystem relative to their abundance in an undisturbed ecosystem. When an MSA is measured as 100%, this indicates an undisturbed level of biodiversity in an ecosystem. The MSA considers land use, greenhouse gas emissions, nitrogen oxide emissions and freshwater use. The MSA can be used as a target and Key Performance Indicator (KPI) by a company wanting to reduce negative impacts or increase positive impacts on nature. This may subsequently be disclosed in the future by companies through upcoming disclosure frameworks such as the Taskforce for Nature Related Financial Disclosures (TNFD) or biodiversity-related Science-Based Targets Network (SBTN).
Portfolio Exposure to Nature
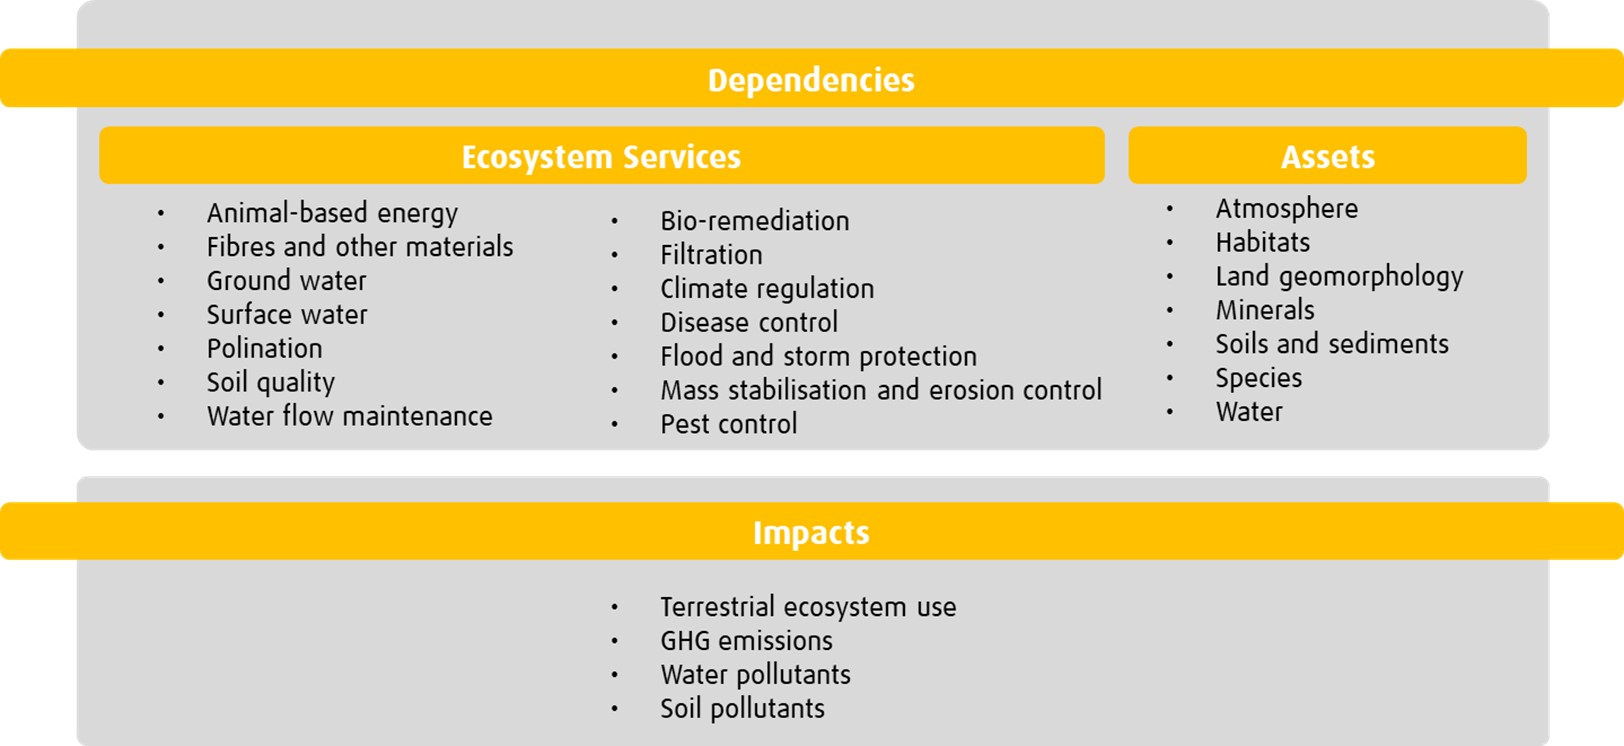
Source: ENCORE
Taking Action on Biodiversity
Learn more about this engagement work, and other similar campaigns in our 2022 Responsible Investment Annual Report.
1 https://www.bcg.com/publications/2021/biodiversity-loss-business-implications-responses
2 https://www.ipbes.net/global-assessment (2019)
3 https://www.ipbes.net/global-assessment (2019)
4 https://www.choicesmagazine.org/UserFiles/file/article_49.pdf
5 https://www.heritage.nf.ca/articles/economy/moratorium.php
6 https://climatefundsupdate.org/wp-content/uploads/2020/03/CFF5-2019-ENG-DIGITAL.pdf
7 https://www.un.org/en/climatechange/science/climate-issues/biodiversity
8 https://www.epa.gov/controlling-air-pollution-oil-and-natural-gas-industry/basic-information-about-oil-and-natural-gas
9 https://rosslandtelegraph.com/2015/08/06/billions-and-billions-economic-costs-invasive-species-38770
10 https://ccli.ubc.ca/wp-content/uploads/2021/06/The-emergene-of-foreseeable-biodviersy-related-liability-risks-for-financial-institutions.pdf
11 https://cdn.cdp.net/cdp-production/cms/reports/documents/000/006/918/original/CDP-Supply-Chain-Report-2022.pdf?1678870769
12 https://tnfd.global/
13 https://www.globalreporting.org/standards/
14 https://www.cdp.net/en/info/about-us/what-we-do
15 https://www.cdp.net/en/articles/governments/bridging-the-sdg-data-gap-for-biodiversity-and-nature
16 https://www.environmental-finance.com/content/market-insight/measuring-the-biodiversity-footprint-of-a-portfolio.html
17 https://www.ibat-alliance.org/the-data?locale=en
18 https://www.worldbenchmarkingalliance.org/nature-benchmark/
19 https://www.qmul.ac.uk/sbbs/media/sbbs/research/bsc-project/QMUL-QuantifyingBiodiversityImpact2022.pdf
20 https://s3.eu-west-2.amazonaws.com/ncfa.documents/resources/hotspots_methodology.pdf
Disclaimer
This article is for information purposes. The information contained herein is not, and should not be construed as, investment, tax or legal advice to any party. Particular investments and/or trading strategies should be evaluated relative to the individual’s investment objectives and professional advice should be obtained with respect to any circumstance.
Any statement that necessarily depends on future events may be a forward-looking statement. Forward-looking statements are not guarantees of performance. They involve risks, uncertainties and assumptions. Although such statements are based on assumptions that are believed to be reasonable, there can be no assurance that actual results will not differ materially from expectations. Investors are cautioned not to rely unduly on any forward-looking statements. In connection with any forward-looking statements, investors should carefully consider the areas of risk described in the most recent prospectus.
Commissions, management fees and expenses (if applicable) may be associated with investments in mutual funds and exchange traded funds (ETFs). Trailing commissions may be associated with investments in mutual funds. Please read the fund facts, ETF Facts or prospectus of the relevant mutual fund or ETF before investing. Mutual funds and ETFs are not guaranteed, their values change frequently, and past performance may not be repeated.
For a summary of the risks of an investment in BMO Mutual Funds or BMO ETFs, please see the specific risks set out in the prospectus of the relevant mutual fund or ETF. BMO ETFs trade like stocks, fluctuate in market value and may trade at a discount to their net asset value, which may increase the risk of loss. Distributions are not guaranteed and are subject to change and/or elimination.
BMO Mutual Funds are offered by BMO Investments Inc., a financial services firm and separate entity from Bank of Montreal. BMO ETFs are managed and administered by BMO Asset Management Inc., an investment fund manager and portfolio manager and separate legal entity from Bank of Montreal.
BMO Global Asset Management is a brand name under which BMO Asset Management Inc. and BMO Investments Inc. operate.
®/™Registered trademarks/trademark of Bank of Montreal, used under licence.